Every "will AI take my job" tool hands you one number and no way to argue with it. Nothing tells you what "73% automatable" was measured against, or what would have to be true for it to be wrong.
So I built one for 1,000 US occupations and documented everywhere it breaks.
Exposure isn't replacement
Two published benchmarks anchor the model. Microsoft scored occupations by how applicable AI is to the tasks inside them. Anthropic's Economic Index went a step further and measured which tasks people actually bring to Claude, from millions of real conversations. Both measure the same thing: how much of a job's work overlaps with what AI gets used for. Neither one can tell you whether the job survives, though.
| AI-exposed work | done instead of the person | done alongside the person | |
|---|---|---|---|
| Psychiatrists | 0.70 | 0.22 | 0.47 |
| Software Developers | 0.89 | 0.87 | 0.02 |
They have similar amounts of AI-exposed work and opposite outlooks, because prescribing is legally reserved to a licensed human and writing code isn't. A single exposure score puts those two in the same bucket.
So I split the benchmark score with what I call a shield: how much of the job needs this specific human regardless of what the software can do. Displacement is what the shield doesn't cover.
That's what the last two table columns are: benchmark exposure times the shield. The developers' 0.02 alongside isn't measured, it's the model concluding that almost nothing about writing code legally requires a particular person. You can argue with that, and the shield is the part built to be argued with.
The task score tracks Anthropic's numbers at Spearman 0.856. The shield has no equivalent check. No ground-truth dataset of AI displacement exists, and the benchmarks measure exposure, so checking a displacement discount against them would be circular. The shield is my opinion, and every number it touches is labeled that way on the site.
The government dataset that nearly broke the model
Most of the shield comes down to one question: does the law require a licensed human to do this job? I had answered that by hand, which felt like the weak point. So when an agent turned up an official source, I wanted it to be the answer. CareerOneStop publishes 27,067 licenses coded to occupation and state, through the Department of Labor.
Applied directly it agreed with my hand-built values 55% of the time.
There were two problems, and neither could be fixed with a threshold. It's keyed to occupation codes broader than my job list, so 201 codes carry more than one of my occupations. Lobbyists and Patent Examiners share a code with eighteen attorney roles and both inherit "Attorney, licensed in 51 states," which is 50 plus DC as the dataset counts them. Neither needs a bar exam.
The second one is worse. It records that a license maps to an occupation, not that you need one to do the work, and that distinction is the whole reason the shield exists. It attaches "Professional Engineer, 50 states" to 39 engineering roles. You need a PE to stamp drawings, not to be employed as a mechanical engineer.
My hand-built values were more accurate in every one of those cases. Using the official dataset would have made the model worse while letting me write "sourced from Department of Labor data" on the methodology page.
I kept it as an auditor instead. It raised 117 flags. Thirty were real gaps, mostly clinical: physical and occupational therapists, speech-language pathologists, radiologic technologists, licensed practical nurses. Those are fixed. The other 87 are explained by written rules, so the audit now reports zero.
Two fixes that failed
Chief executives hold no license and sit at a desk, so the shield gave them almost nothing and they scored 0.63 displacement. CFOs came out at 0.71, highest of anything paying over $150k. Those two are the numbers as the model stood then; the data underneath has been rebuilt since, for reasons at the end.
Nobody believes that. The tempting move is to add a term until the number looks right.
First attempt was O*NET's "Freedom to Make Decisions." It measures self-reported autonomy, which isn't authority. Data Entry Keyers score 4.52 on it, above financial managers at 4.34 and registered nurses at 4.23. A term meant to find where responsibility sits would have ranked one of the most routine jobs in the catalog above two that carry real duties.
Second attempt, O*NET's "Impact of Decisions on Co-workers or Company Results," behaves better at the extremes and still fails at the case it was picked for. Chief executives sit at 4.36, with 101 of 774 occupations above them, including electricians at 4.67 and public safety dispatchers at 4.73.
They fail for the same reason. Both numbers come from surveying the person in the job, and a survey can't see the org chart or the statute behind a decision.
The question I had been asking, whether a licensed human is required, turned out to be too narrow. Law pins work to a person a second way, by naming someone who has to personally answer for it. Sarbanes-Oxley makes the CEO and CFO personally certify every financial report, with criminal liability for a false one, which is exactly what my strictest category already described, minus the license.
That moved chief executives from 0.63 to 0.21, using a term that already existed. Ten occupations carry it now: chief executives and CFOs under Sarbanes-Oxley, pension fund managers under ERISA, bank compliance officers, data privacy officers, radiation safety officers, nonprofit directors who sign IRS Form 990 under penalty of perjury, and founders and franchise owners, who personally hold the downside.
Not building a flattery machine
Shielding well-paid desk jobs is how a model like this turns into "people like me are fine." Two tests run on every build.
Senior, well-paid roles with no personal legal duty have to stay unshielded. Chief marketing officers hold at 0.58, technical program managers at 0.65, financial managers at 0.64. None of them moved when I widened the definition.
And the shield has to keep correlating negatively with pay. It was -0.29 before the executive change, because physical demand drove it and physical work pays less. Now it's -0.26. Moving toward zero was expected. If it goes positive, the model has started tracking status instead of law and the build fails.
The agent wrote that second test wrong the first time. It asserted that well-paid roles get shielded less often. They don't, and they shouldn't. The best-paid jobs include surgeons, anesthesiologists, pilots and lawyers, partly well paid because licensure makes them scarce. The test was measuring a real relationship and calling it a bug.
The education chart was hiding 110 dots
One of the site's charts answers "does more education mean higher pay?" by plotting all 1,000 occupations as dots: education level across the bottom, salary up the side.
It used to cap its salary axis at the 95th percentile so the bulk of the data stayed readable, and printed "50 jobs above $160k not shown."
Nothing was clipping them. 110 dots were painted above the plot frame with no axis to read them against, scattered over the note announcing they were hidden.
The agent's first fix clipped the plot area, which made the note true and silently dropped 79 occupations, including the highest-paid job in the catalog. It reported the chart fixed. When I looked, jobs were missing off the top, so I sent it back.
The real problem was the linear axis. Pay runs $31k to $496k, so the top 5% eat 72% of the height and everything else compresses into a strip. Pay is multiplicative: the difference that matters between salaries is twice as much, not $50k more. On a log axis that same 5% takes 41% and nothing has to be hidden. The live chart is that version.
How it got built
I ran AI agents for the implementation. I set the direction and judged what came back; the agents handled everything in between. The ideas and the standards were mine, and so was every call described above. It would be strange to spend a whole post on the model's blind spots and then dodge how the post got made, so here's the split.
The model exists because I refused to believe a number. The site's original headline said psychiatrists were among the most AI-exposed jobs in America, and that didn't sit right. Nobody gets a prescription from a chatbot. I had the agent walk me through its reasoning until the real problem surfaced. Exposure and replacement are different questions, and the benchmarks only answer the first one. Everything above follows from that.
Working this way I spent almost no time waiting on code. Most of the work was deciding whether to believe it. The agent sounds exactly as confident when it's wrong as when it's right, and it will report something finished that isn't. My job was deciding what the model believes and rejecting work that didn't survive checking. Both failures above went through that loop: the license dataset arrived as an agent suggestion I ended up overruling, and the education chart got called fixed twice before it actually was. Not all of the checking was me. Every build runs 90 tests, and audit scripts sweep all 1,508 static pages and re-check the license data. I decided how far the legal-barriers definition reaches, where the cap sits, which roles stay exposed, and what got thrown away. Leaving chief marketing officers and chiefs of staff exposed was my call, and it's the one that keeps this from becoming a model that protects job titles.
What's still wrong
Roles held by organizational authority alone, with no legal duty anywhere, have no term in the shield. Chief marketing officers and technical program managers score as highly exposed and I have nothing to say for them. I'd rather leave them exposed than protect seniority as a category.
Sarbanes-Oxley binds public company officers. The occupation "chief executives" also covers whoever runs a twelve-person firm, who has no such duty, and I can't split an occupation the pay data doesn't split.
The shield weights are mine and nothing external can settle them.
One thing was wrong enough that I rebuilt it after publishing this. Plotting a thousand occupations at once, the dots fell in stripes, which real data does not do. I had been rounding ONET's work-context surveys to whole numbers on ingest, so a continuous average became four values, and four of those times four legal-barrier levels left the shield only nine numbers to land on. Deleting the rounding took it from 9 distinct values to 313. Nothing had looked wrong: a badge reading "physical demand: 3 of 5" is exactly what you expect to see. A later audit caught a second one in this piece: both ONET figures I had quoted for chief executives were the wrong SOC sub-code, Chief Sustainability Officers rather than Chief Executives, and the numbers above are the corrected ones. The numbers above are the corrected ones, and agreement with the Anthropic benchmark went up rather than down, which is the only reason I trust the fix.
This has been tried before and gone badly. Frey and Osborne put 47% of US employment at high risk of computerization in 2013, and the labor market spent the next decade embarrassing that number. This could be that. The differences are task-level usage data instead of occupation-level expert guesses, and this list.
I offered a test in the first version of this piece and it was a bad one. It said licensed clinical work, physical therapists and registered nurses, should hold employment better than unlicensed desk work, paralegals and data entry. It wins against the current BLS projections, 11.9% and 5.6% against -0.3% and -25.5%, and it wins for the wrong reason: both winners are healthcare and both losers are not, so an aging population passes that test whether or not licensure does anything. Tested properly the relationship is not there. The shield and projected employment change correlate at 0.09 across 960 occupations, and at -0.03 once healthcare is removed. That is not a refutation, because BLS projections cover employment change from every cause and do not model AI at all, so no result here could confirm the model either. It does mean that the most obvious place to look for outside support does not offer any.
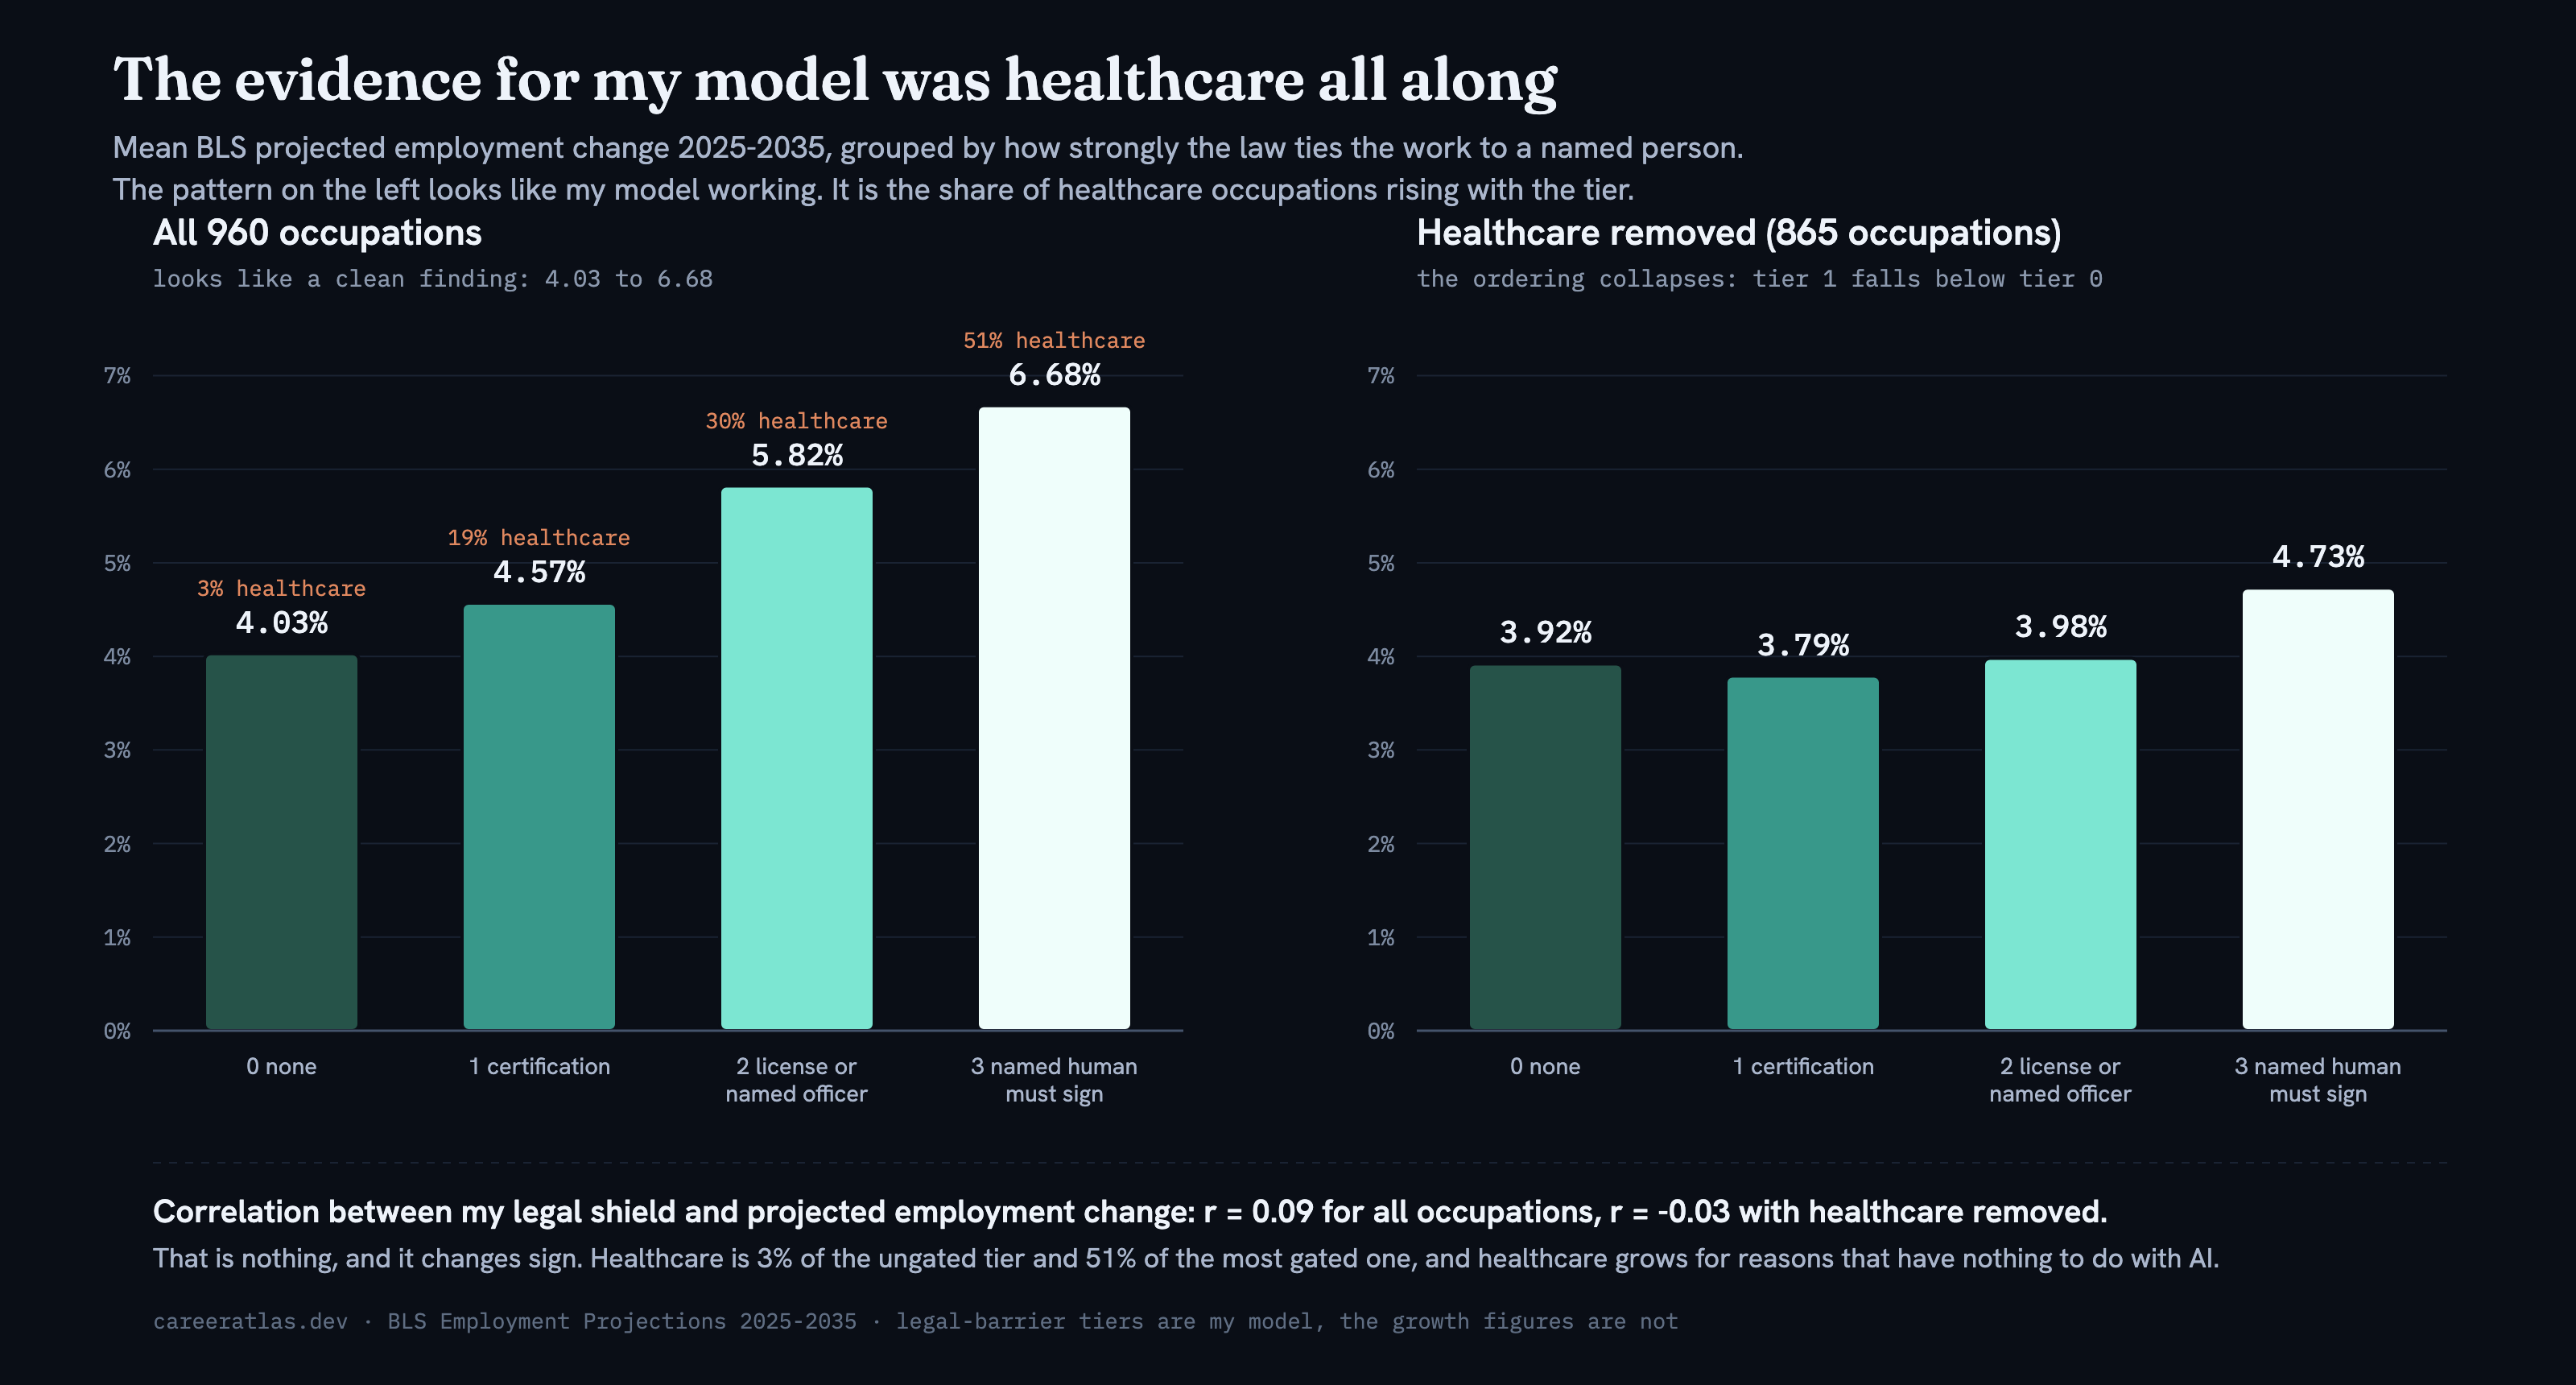
Healthcare is 3% of the ungated tier and 51% of the most gated one.
The honest version of the test stays inside a sector, where licensure is the only thing varying: licensed occupations should hold employment better than their unlicensed neighbors over the next five years of BLS releases. Right now they do not.
Full methodology at careeratlas.dev/methodology, including the parts that make it look bad.
The rest of the site is the map itself: 1,000 occupations with pay, outlook, and these numbers on every one. Look up your own job and argue with it.